A final US election update
Plus, Q3 nowcasts; house prices; and Bullock’s Plan B
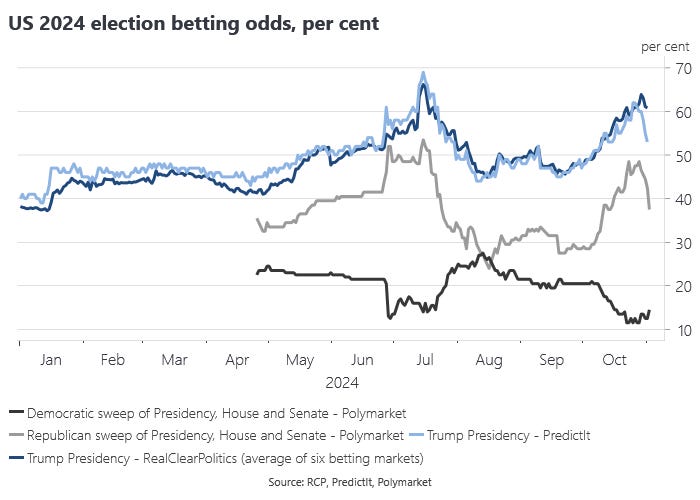
Betting market odds on the US Presidential election have narrowed, which is to be expected as the election date gets closer. There is some interesting divergence between PredictIt and the RCP aggregate measure that excludes PredictIt. Some might attribute that divergence to a pro-Trump bias in Polymarket, but PredictIt has given a stronger probability to a Trump win for much of this year, so it is not clear that a systematic bias is at work.
Elevated volatility measures in more established wholesale financial markets reviewed here previously can be taken to imply a close race on the assumption that financial markets dislike uncertainty. I suspect the prediction market odds will continue to narrow as the election gets closer. It is also worth recalling that prediction markets will get very volatile as the votes are counted. Base case remains for a close result with an extended count throwing off lots of uncertainty and associated financial market volatility. More worryingly, a close contest would provide cover for an attempted Trump putsch.
Like macro and financial market variables, voting intentions are a stochastic rather than a deterministic process. In the quantitative political science literature, the vote share is often modeled as a heterogeneous data generating process (technically, an order of integration between 0 and 1). The intuition behind that approach is that some voters are rusted on and some voters swing, so you are aggregating across at least two very different processes, with the added complication that the voting population won’t be the same each time. Even if you had a good model of the vote share, there is the further complication of the translation of the vote share into electoral college votes.
Most election models, by contrast, are pretty deterministic. For what it is worth, Ray Fair’s model based in part on macroeconomic variables yields a Democratic vote share of 49.47% for President and 47.36% for the House, but with a standard error of three percentage points, making the estimated outcome too close to call. Ray’s model is very old fashioned, but good enough as far as macro models of the vote share go. It assumes a voter loss function not unlike that assumed for central banks.
The high rate of inflation earlier in the Biden administration’s term punishes the Democrats in Fair’s model. While inflation has moderated, it is worth recalling that the increase in the price level is permanent in the absence of future deflation. The higher price level is a negative and permanent real wealth shock for many. Incumbent governments are being punished for inflation all around the world. Together with partisan effects, inflation probably accounts for poor consumer sentiment against the backdrop of a US economy that is otherwise doing very well in both relative and absolute terms.
Elections are not won on relative economic performance, but the US Q3 national accounts underscore how remarkable the post-pandemic recovery has been in the United States relative to its peers. This might help explain why the incumbent party in the US is still very competitive. Real GDP per capita is one of the variables in Ray Fair’s model, alongside inflation and provides an offset to the effects of inflation, yielding his very narrow vote share prediction.
As for nominal GDP, Michael Sandifer’s NGDP gap concept is based on the idea that the economy should grow in line with the return on capital in long-run equilibrium. Q3 nominal GDP is growing 1.5 percentage points faster than the S&P 500 earnings yield.


