
Nowhere to hide
Kevin Warsh and the core PCE decomp
The US CPI and PCE deflator are perhaps among the most widely and thoroughly decomposed time series on the planet. The point of these decompositions is to shed light on the drivers of inflation. Under an inflation targeting regime, we want monetary policy to look through temporary supply shocks, such as spikes in the oil price, and focus instead on the demand-driven or cyclical component.
As it happens, decomposing core PCE into cyclical and acyclical inflation rates in April yields readings identical to the overall core measure.
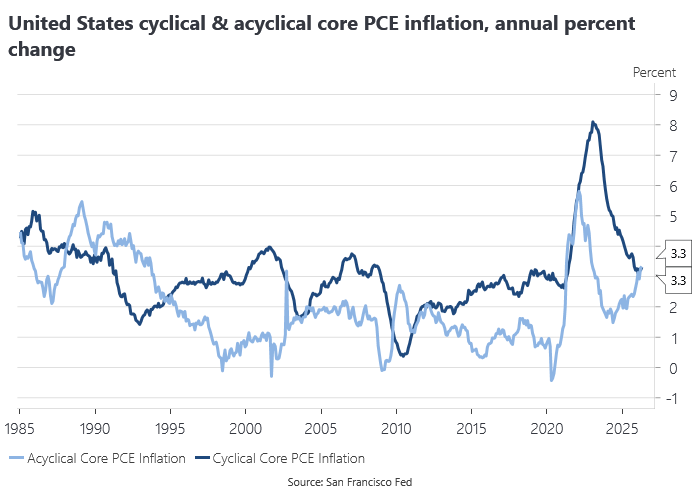
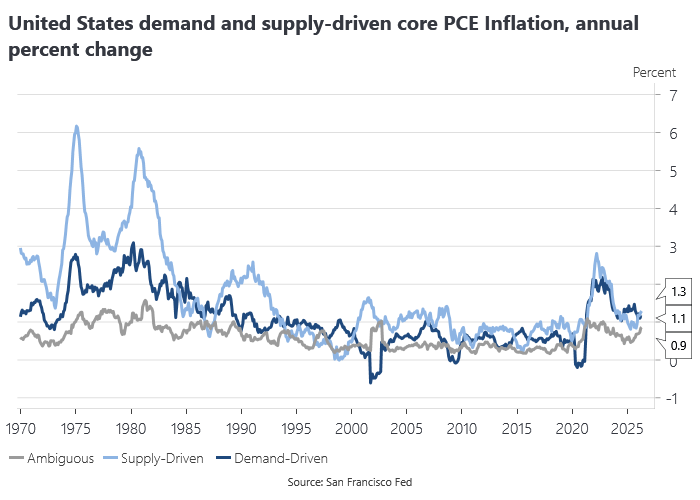
If we think the overall core PCE measure is running too hot, then looking at the cyclical component is not going to buy us any more comfort than we find in the overall measure. A similar decomposition into supply and demand-driven components for core PCE inflation also points to nearly identical rates of inflation for each, although with a residual/unattributed component that is almost as large in its contribution.
Statistical core PCE
The US CPI and PCE deflator are perhaps among the most widely and thoroughly decomposed time series on the planet. The point of these decompositions is to shed light on the drivers of inflation. Under an inflation targeting regime, we want monetary policy to look through temporary supply shocks, such as spikes in the oil price, and focus instead on the demand-driven or cyclical component.
As it happens, decomposing core PCE into cyclical and acyclical inflation rates in April yields readings identical to the overall core measure.
If we think the overall core PCE measure is running too hot, then looking at the cyclical component is not going to buy us any more comfort than we find in the overall measure. A similar decomposition into supply and demand-driven components for core PCE inflation also points to nearly identical rates of inflation for each, although with a residual/unattributed component that is almost as large in its contribution.
Statistical core PCE
Instead of decomposing inflation into contributions from supply and demand-side influences, we can also focus on statistical measures of core inflation. These measures are based on the idea that the central tendency of the inflation distribution is the most persistent and better forecasts future inflation.
The Reserve Bank of Australia moved in the direction of using statistical core measures like the trimmed mean in the mid-2000s because the previous exclusion-based measures of underlying inflation became less reliable when some of the excluded items started exhibiting trending behaviour in the context of the terms of trade boom.
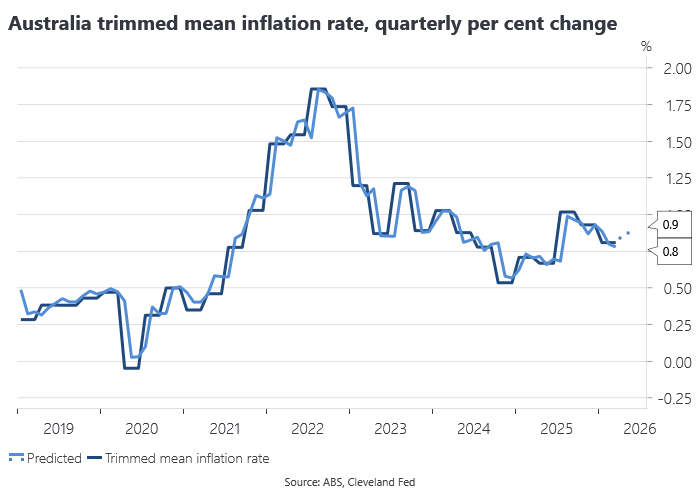
The new US Federal Reserve chair, Kevin Warsh, likes to point to the Dallas Fed’s trimmed mean measure of PCE inflation as evidence that PCE inflation is not running as hot as the headline PCE measure would suggest. As shown below, the trimmed mean is currently one of the most flattering ways of looking at PCE inflation.
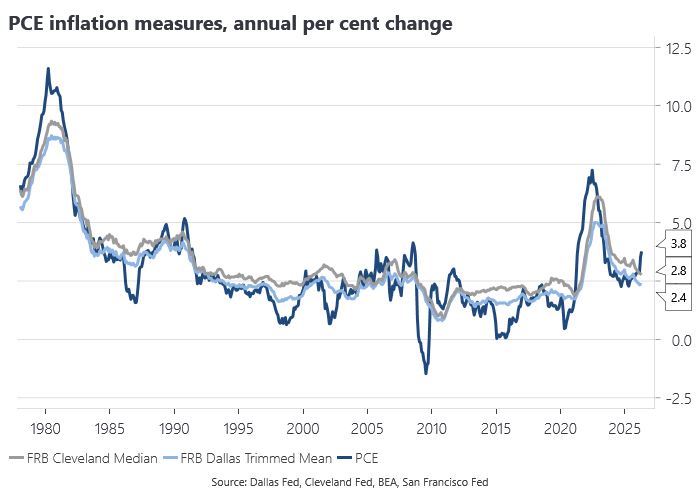
But as the chart above also makes clear, the trimmed mean is a lagging indicator of the headline PCE inflation rate. One of the potential dangers in the proliferation of CPI and PCE decompositions is that it facilitates cherry-picking on the part of policymakers. That problem becomes all the more serious when the policymaker in question shows evidence of having a partisan-inflected policy bias.
Prices as symptoms, not causes
In a recent post, Claudia Sahm considered measures of the breadth of inflation, showing that current inflation pressures are showing up more in the tails of the distribution of PCE inflation. But as Marcus Nunes notes in his response to Sahm, prices are where inflation shows up, not where it comes from:
whether today’s narrow inflation broadens tomorrow is not a property of the distribution. It is a property of the monetary regime — of whether nominal spending keeps running hot.
The distribution only tells you where the inflation pressures first appear, not what is driving them.
Which bring us to nominal GDP. Headline nominal GDP growth was running at 5.9% in Q1, which happens to be almost identical to the annual growth rate in the Divisia M4 monetary aggregate.
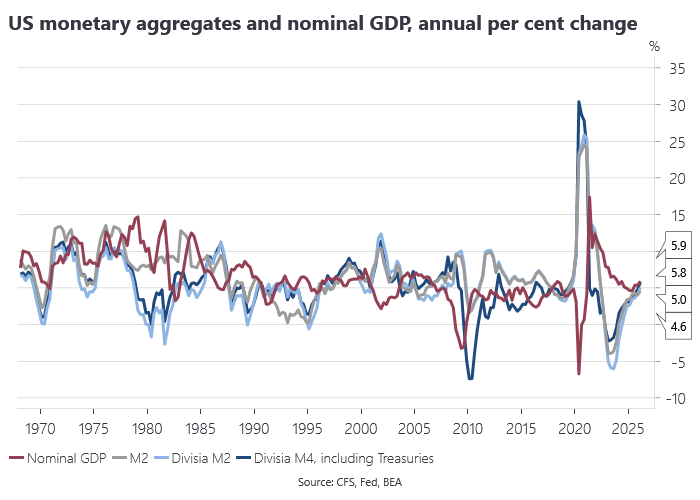
That might be viewed as just a happy coincidence given that the historical relationship between the two growth rates is somewhat loose, but it is consistent with long-run re-convergence in the two series following the pandemic-era money demand shock. With nominal GDP and Divisia M4 growing at similar above-trend rates, it is not surprising that the headline inflation rate looks much like its demand-side drivers would imply.
The Mercatus measure of the NGDP gap was +3.1% in Q1, having narrowed from a peak of +7.6% in Q3 2023. The implied valuation gap with the US 10-year Treasury yield has also narrowed significantly, but still leaves Treasuries somewhat rich relative to the historical relationship with the gap.
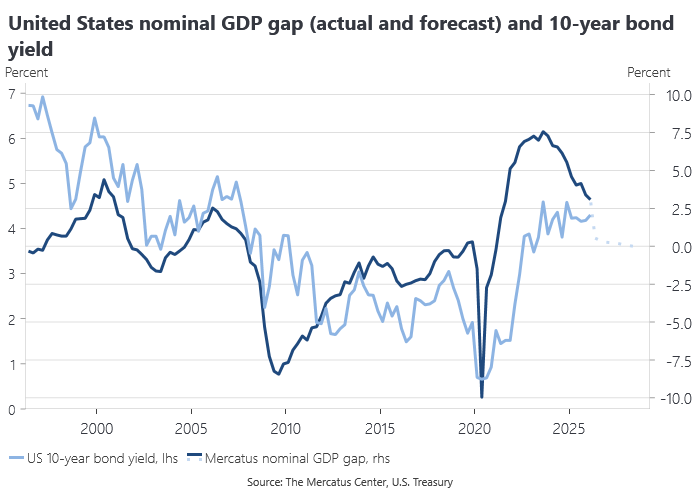
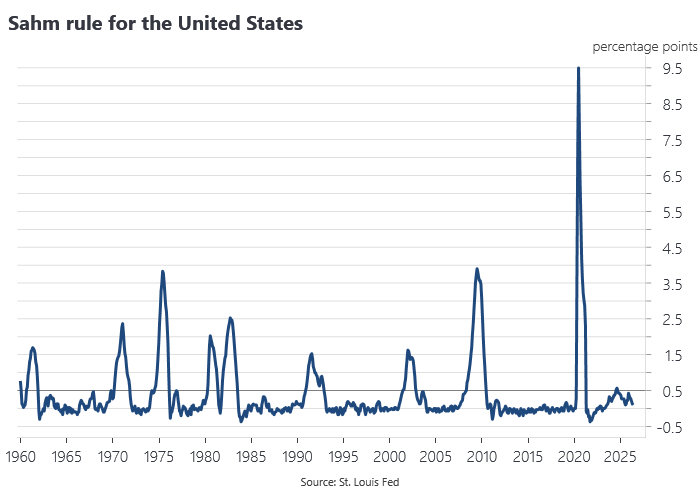
All of which is to say that Kevin Warsh won’t be able to hide behind supply-side inflation or the Dallas Fed trimmed mean measure to avoid having to tighten monetary policy. Concerns about the strength of the US labour market have also abated. The labour market came within seven-tenths of a percentage point of triggering the Sahm rule in November last year, having yielded a brief false positive above the 0.5 threshold in 2024, but was just 0.13 in April this year.
Nobody loves tightening into an oil price shock more than the ECB and that is what we saw this week. The turn-of-the-year consensus singled out the BoJ as the only major central bank expected to tighten in 2026. In retrospect, the RBA’s February 2026 rate hike was the canary in the coal mine for a renewed global tightening cycle in 2026, suggesting the consensus was wrong-footed very early in the year. The May print for the Cleveland Fed’s trimmed mean CPI is consistent with a 0.9% q/q print for Australia’s trimmed mean inflation rate in Q2.
ICYMI
Babies don’t make public policy. And Scott Sumner’s mum turns 100.
Economic freedom and the environment: Causal evidence from liberalization reforms.
The Paris-to-Sacramento Pipeline: How Three Economists Built a Blueprint for Taking Your Stuff.
Navigating the Amazon: The Incidence of Digital Service Taxes.