This month marks the 44th anniversary of the Julian Simon-Paul Ehrlich wager on the trend in real commodity prices. If you are not familiar with the wager, I highly recommend The Bet by Paul Sabin, which recounts the wager and its broader social and political context. The wager was not really about commodity prices as such, but rather the broader political, economic and environmental implications of any trend in those prices.
Simon left the choice of commodities and the time frame for the wager to Ehrlich. Ehrlich nominated chromium, copper, nickel, tin and tungsten and a timeframe of ten years, commencing on 29 September 1980. If the real price of these commodities rose, Simon was to pay Ehrlich the amount of the price increase and vice versa. Ten years later, the nominal and real prices of each of the five commodities had fallen, and Ehrlich mailed a cheque to Simon. Simon then proposed another, larger bet, again leaving the choice of commodities and timeframe to Ehrlich. Ehrlich declined the second wager.
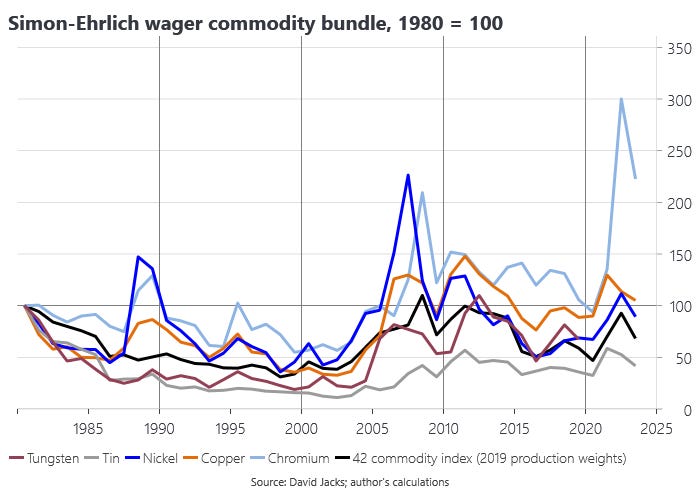
We can check-in how the original Simon-Ehrlich wager is going via David Jacks’ historical commodity price index, which has now been updated for 2023. Tungsten is not part of his 42-commodity index. However, the USGS provides an inflation-adjusted price series for tungsten through to 2019. It is not strictly comparable to the Jacks indices given differences in price deflator, but is good enough for our purposes.
Indexing the Jacks series to equal 100 in 1980, we can see how Simon won the original bet, with all five commodities below 100 in 1990. Had the bet been based on all 42 commodities in the Jacks dataset, Simon would have also come out ahead. It was the same story in the following decade, with real commodity prices trending lower through to 2000.
The next decade from 2000 through to 2010 is more complicated. The accelerated industrialisation and urbanisation of China led to a surge in commodity prices that was also responsible for Australia’s then record high terms of trade. The upward trend was interrupted by the 2008 financial crisis, which saw a major downturn in the world economy to close out the decade. These two opposing shocks still left the 42 commodity index lower in 2010 than it was in 1980, although higher than in 1990 and 2000. Of the original Simon-Ehrlich commodity bundle, chromium, copper and nickel were higher in 2010 than in 1980. It is remarkable, however, that the massive shock from the industrialisation and urbanisation of China left the broader 42-commodity index no higher than it was in 1980.
Real commodity prices mostly trended lower in the 2010s. The pandemic shock in 2020 once again saw both the Simon-Ehrlich bundle (not including tungsten) and the broader index lower than they were in 1980. The war in Ukraine has since seen a spike in commodity prices in 2022, with chromium in particular sharply higher given Russia’s significant role in global supply. As of 2023, only copper and chromium are higher in inflation-adjusted terms than they were in 1980, with the 42-commodity index lower.
Putting Simon and Ehrlich behind a notional ex post veil of ignorance, we can backdate the wager to 1900 using the Jacks data and ask who would have won a 123-year bet. Only copper and nickel are lower in real terms in 2023 than they were 1900, although this result is largely a function of the China shock in the 2000s and the recent war in Ukraine. Simon unambiguously won the first 99 years of a hypothetical 123-year bet made in 1900.
All bets aside, the trend in real commodity prices is empirically testable, although also a more complicated issue than you might think. The Prebisch–Singer hypothesis literature tackles much the same question. The choice of deflator matters a lot and you quickly get into some very profound and complicated issues around measuring long-run price change. But running ocular econometrics on the above charts, it is hard to conclude anything other than that Simon has the better of the argument for at least a century.


